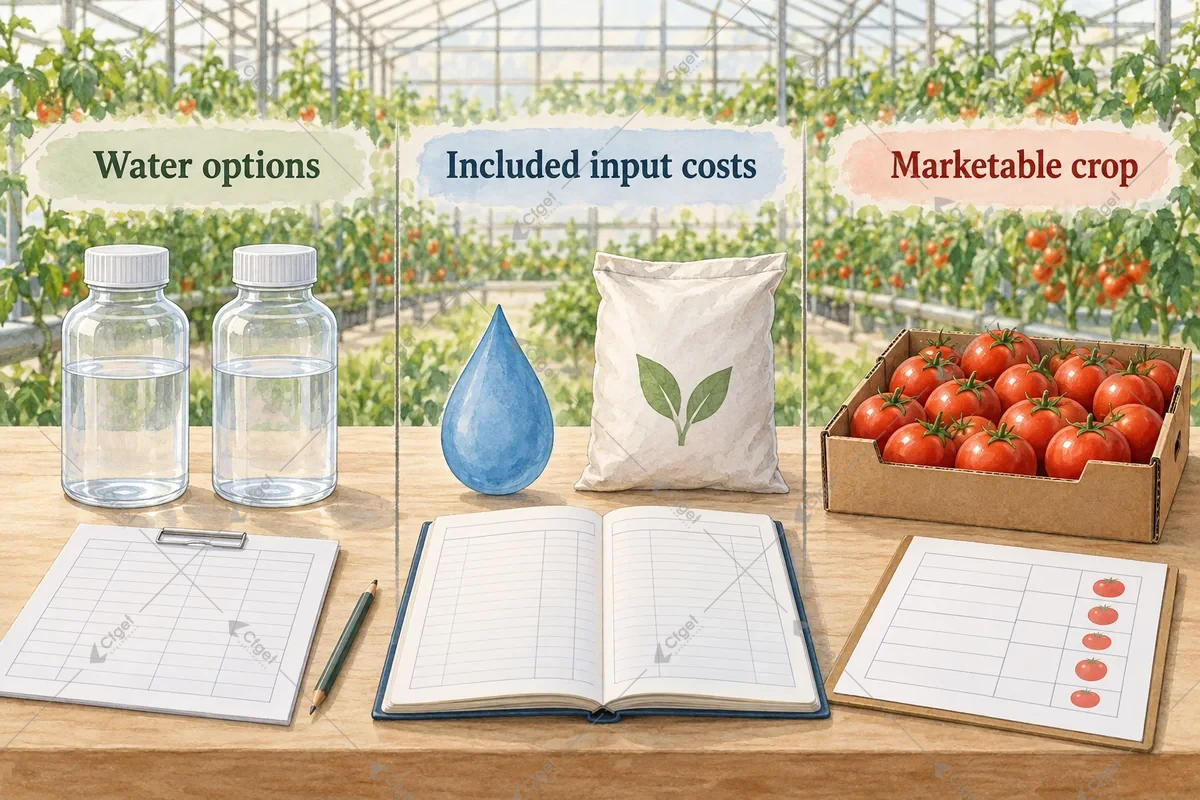
A lower water bill does not necessarily mean a lower input cost per saleable tomato. If a source-water change reduces accepted output, the remaining crop has to carry more of the input cost. Compare water options against the marketable harvest and name exactly which costs the comparison includes.
This is a crop-economics decision. The best local choice also needs suitable water chemistry, reliable supply and an operating plan, but a water price by itself cannot settle it.
Read the crop result alongside the water source
Galindo and colleagues’ study, published in December 2025, tested Margmeno RZ pear tomatoes in a 1,935 m² experimental greenhouse in Almería, Spain. The coco-grown, open-hydroponic crop had four row replicates per treatment in each East/West sector. Eight harvests ran from January 18 to March 21, 2024, following September 2023 transplanting.
| Treatment | Raw water EC, dS/m | EC after fertilization, dS/m | West yield, kg/m² | East yield, kg/m² |
|---|---|---|---|---|
| T1: desalinated seawater | 0.60 | 2.5 | 7.69 | 8.60 |
| T2: desalinated/groundwater blend | 1.5 | 3.5 | 6.29 | 7.12 |
| T3: desalinated/groundwater blend | 3.0 | 5.5 | 4.50 | 5.45 |
EC means electrical conductivity. The raw-water and fertigated values describe different points in the system. These treatments are experimental comparisons for one cultivar and short cycle, not recommended EC targets or blending instructions.
Put the denominator under every cost claim
The study’s economic comparison covered fertilizer and desalinated-water cost per kilogram of marketable fruit. T3 had the highest combined cost on that basis in both sectors. Its desalinated-water productivity used kilograms of marketable fruit per cubic meter of desalinated water, excluding groundwater from that water denominator. Neither measure establishes whole-farm profit or total mixed-water productivity.
For a local choice, define the cost boundary before doing the arithmetic. If the question is how much the purchased water and fertilizer cost per accepted kilogram, include those costs consistently for every option. If the question is which option earns more, also examine grade-specific revenue and the other costs that change.
The relationship is straightforward: divide the included cost by the corresponding accepted kilograms. When accepted output falls, cost per kilogram can rise even when expenditure falls. Both parts of the fraction need evidence from the same area and crop period.
Build a comparison the farm can use
Hold the crop and production system constant while comparing the source-water options. Assemble four groups of records:
- Water actually supplied. Record purchased or abstracted volume separately for each source, its delivered or applicable cost and its availability during the crop period. Record source chemistry and the final irrigation-water basis separately.
- Inputs that change. Include the fertilizer and treatment inputs affected by the choice, plus relevant pumping, handling or disposal costs where they are part of the stated boundary. Do not silently treat groundwater as free.
- Accepted crop. Record marketable kilograms by the buyer’s grades and the harvest interval, alongside rejected or downgraded fruit. Keep area definitions consistent.
- Revenue evidence. Use prices the buyer offers for those grades. If a quality attribute is expected to earn more, document that agreement rather than assuming the buyer rewards it.
Run the narrow input-cost comparison first, then a separate comparison of revenue less the costs that differ between options. That distinction helps identify whether a result comes from lower purchases, more accepted crop or a better paid grade.
Do not let an appealing quality result hide lost volume
A sweeter or smaller tomato is commercially useful only in relation to what the buyer accepts and pays for. Even a genuine quality improvement may fail to offset lower saleable volume. Put the expected price response and the output response side by side before choosing the water option.
Also test the comparison without the hoped-for quality premium. If the preferred option changes, buyer evidence is a deciding input. If the decision depends on an assumed crop response outside the farm’s experience, a bounded local validation is more useful than extending one experimental result to every crop.
For the treatment-system questions, see the greenhouse reverse-osmosis design guide. Keep the crop comparison focused on its own decision: which feasible water source supplies the most defensible commercial outcome under this farm’s chemistry, costs and buyer requirements?