If the dry pots sit beside wet ones, adding minutes to the whole irrigation zone may make the wet pots worse. Measure what the emitters deliver before changing the schedule. A timed collection test shows whether the problem is uneven delivery, while pressure observations help explain the pattern.
This test measures the irrigation hardware under a stated operating condition. It does not prove that every substrate bag absorbs water equally or that the chosen pulse fits the crop.
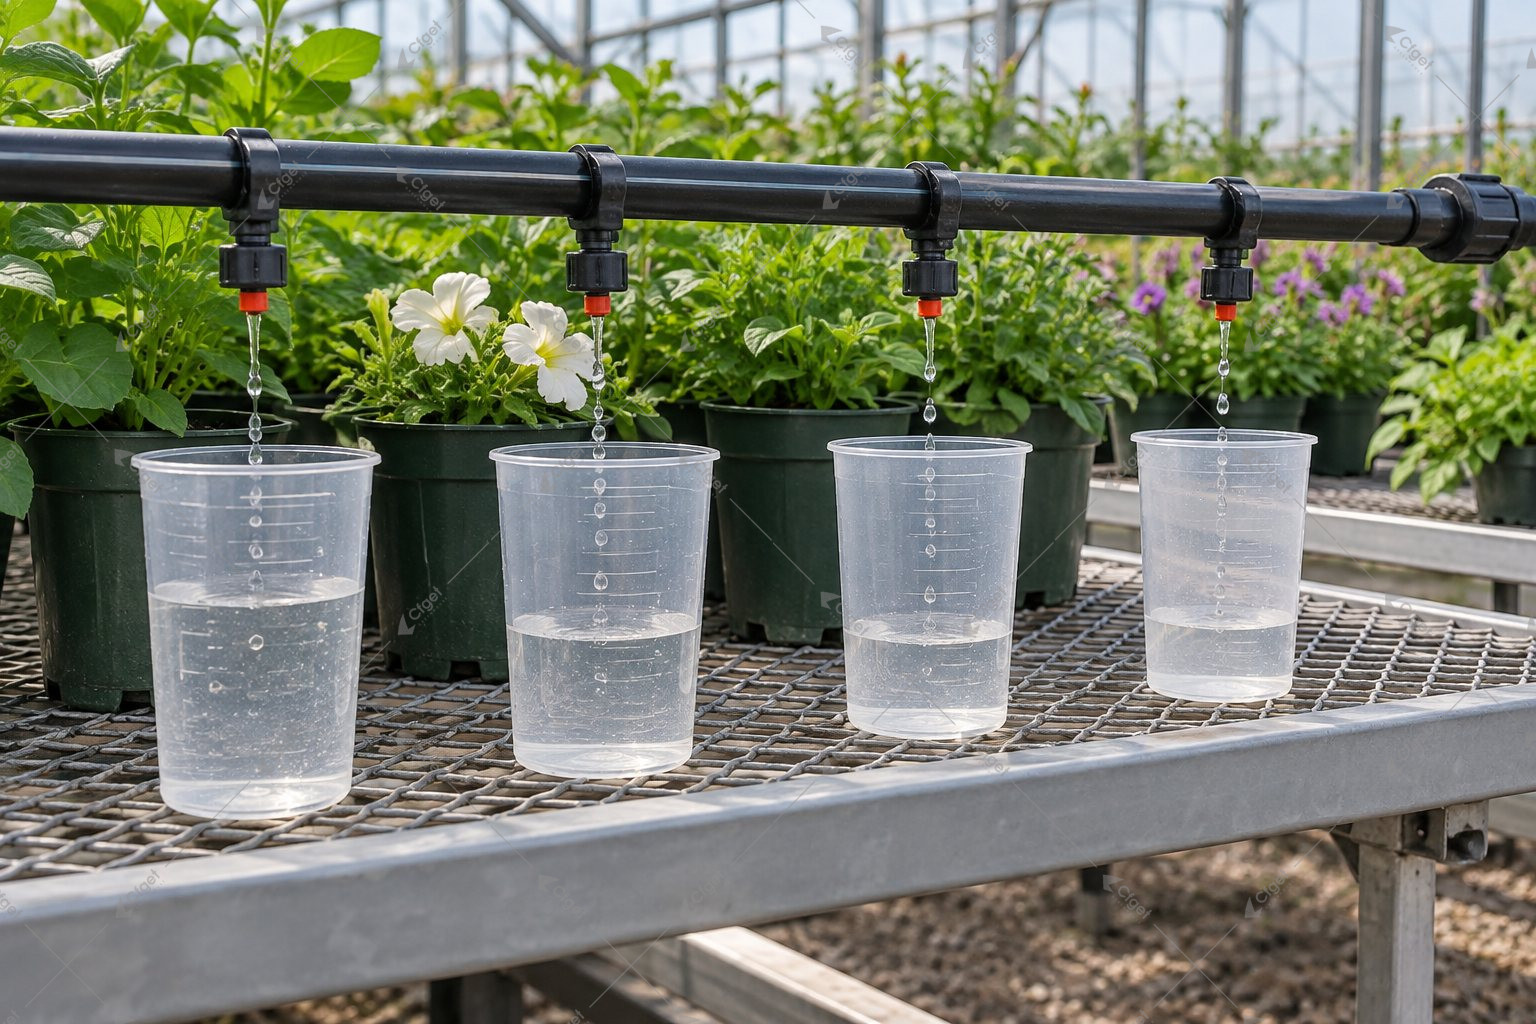
Choose locations before looking for bad emitters
Mark a sampling map that covers the head, middle and end of laterals, near and distant laterals, and relevant elevation changes. Add known problem locations as a separate diagnostic group. Choosing only the worst pots exaggerates the zone-wide result; choosing only convenient outlets can miss the fault.
Keep emitter models and nominal flow rates in separate groups. An intentional mix of different outlets should not be interpreted as manufacturing or maintenance failure. Record the active valves, pump state, filter condition and normal operating pressure during the test.
Oklahoma State’s drip-irrigation guidance explains why pressure variation and small emitter passages matter to distribution. Pressure compensation also operates within a specified range; it is not permission to ignore pressure measurements.
Turn collected volume into delivery rate
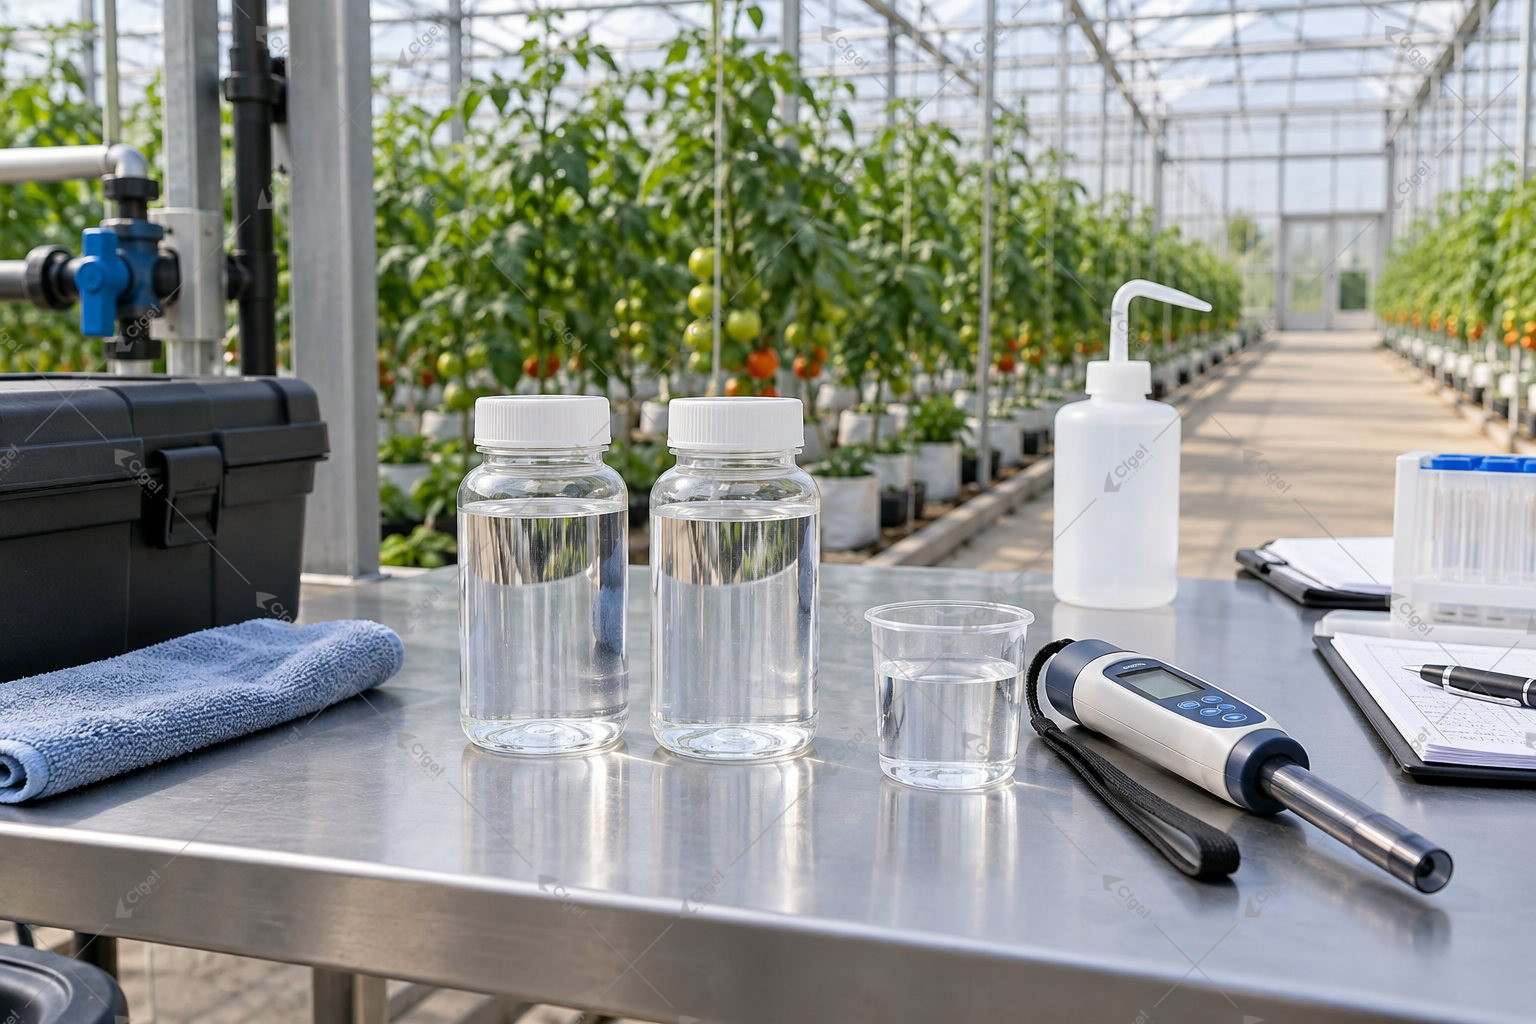
Use clean, stable vessels and a consistent collection interval. Prevent splashing, overflow and accidental collection from two emitters. For a crop in production, agree with the grower how diverted water will be managed so the test does not deprive plants of an intended irrigation.
Flow in litres per hour = collected millilitres / collection minutes x 60 / 1,000. In an illustrative test, 150 mL collected over five minutes equals 1.8 L/h. This is arithmetic using assumed values, not a reported result from a CFGET installation.
Short pulses need an additional operational check: some of the cycle may be spent filling lines before distant outlets deliver normally. A steady-flow test and a complete-pulse test answer different questions. Label them separately and preserve start and stop times.
Calculate the low-quarter result
UC ANR defines low-quarter distribution uniformity as the average of the lowest quarter of measured discharge rates divided by the overall average, multiplied by 100. Arrange the results from low to high before calculating it.
Suppose an illustrative set of 16 comparable emitters has an overall mean of 200 mL over the test interval. The lowest four average 160 mL. The low-quarter result is 160 / 200 x 100 = 80%. This example is not an acceptance standard. Agree the target and measurement procedure for the actual installation with its designer.
Keep the mean flow as well as the uniformity figure. All emitters could deliver equally reduced flow and still produce a strong uniformity number. Conversely, the average could be close to the design value while a low-delivery group remains hidden.
Where the investigation points to filtration, the irrigation filter-sizing guide helps define the next equipment check. A low-flow outlet alone does not prove that a finer filter is the answer.
Let the map guide the next inspection
| Observed pattern | Useful next step |
|---|---|
| Delivery decreases along several laterals | Compare pressure along those lines and inspect the hydraulic operating condition |
| Scattered low-flow outlets | Investigate local blockage, damaged outlets or mixed emitter types |
| Uniform delivery, uneven pot moisture | Inspect stake position, substrate wetting, drainage, root condition and crop demand |
| Only brief pulses are uneven | Review filling, drainage between events and the sequence of valve operation |
The pattern narrows the investigation; it does not identify a deposit chemically. Avoid introducing cleaning chemicals without the equipment and chemical supplier’s procedure.
After a repair, repeat the same mapped test under comparable conditions. Send CFGET and the irrigation supplier the map, individual volumes, pressures, operating state and emitter specification when requesting design help. Those records support a targeted correction and help keep an irrigation-timing change from masking a hydraulic problem.