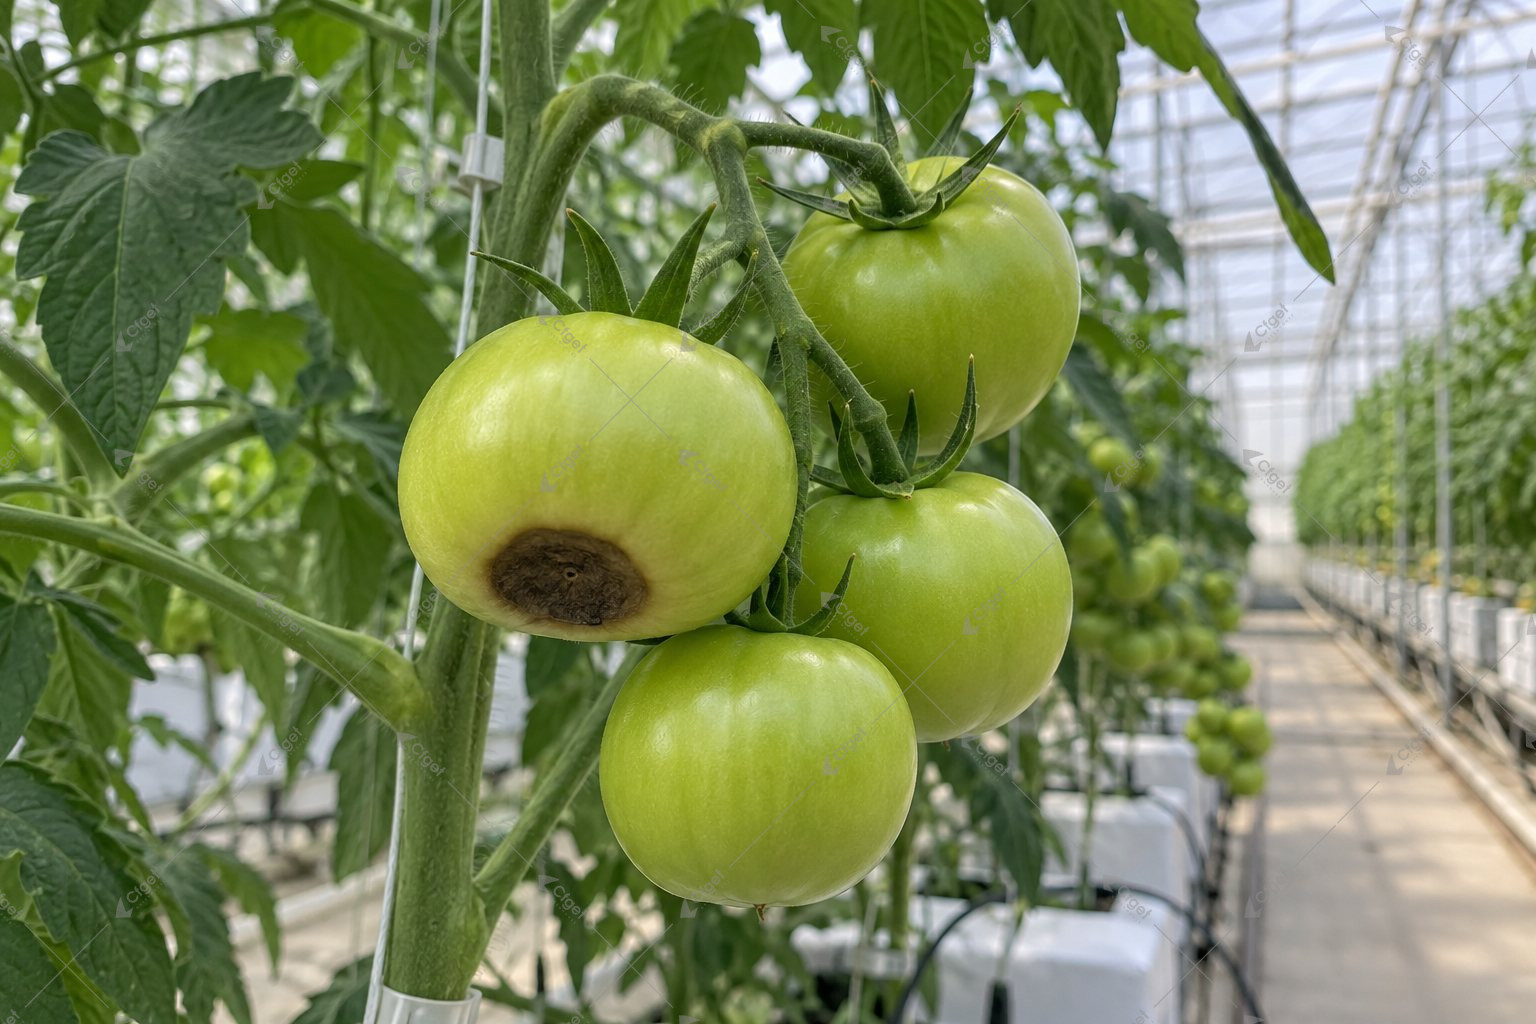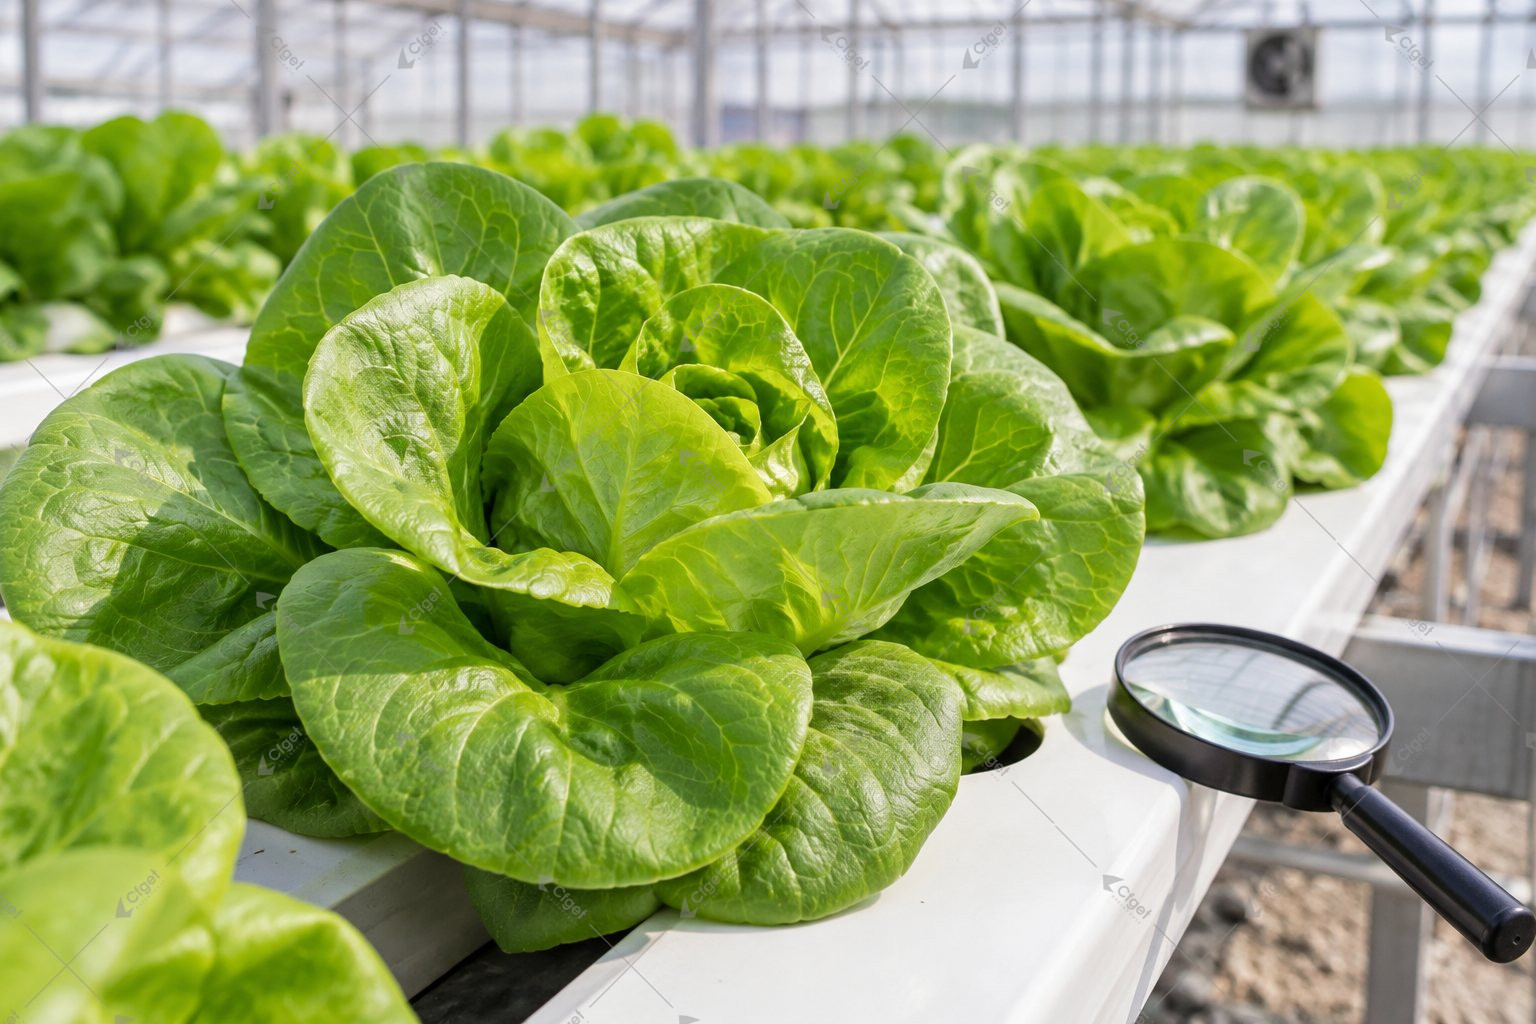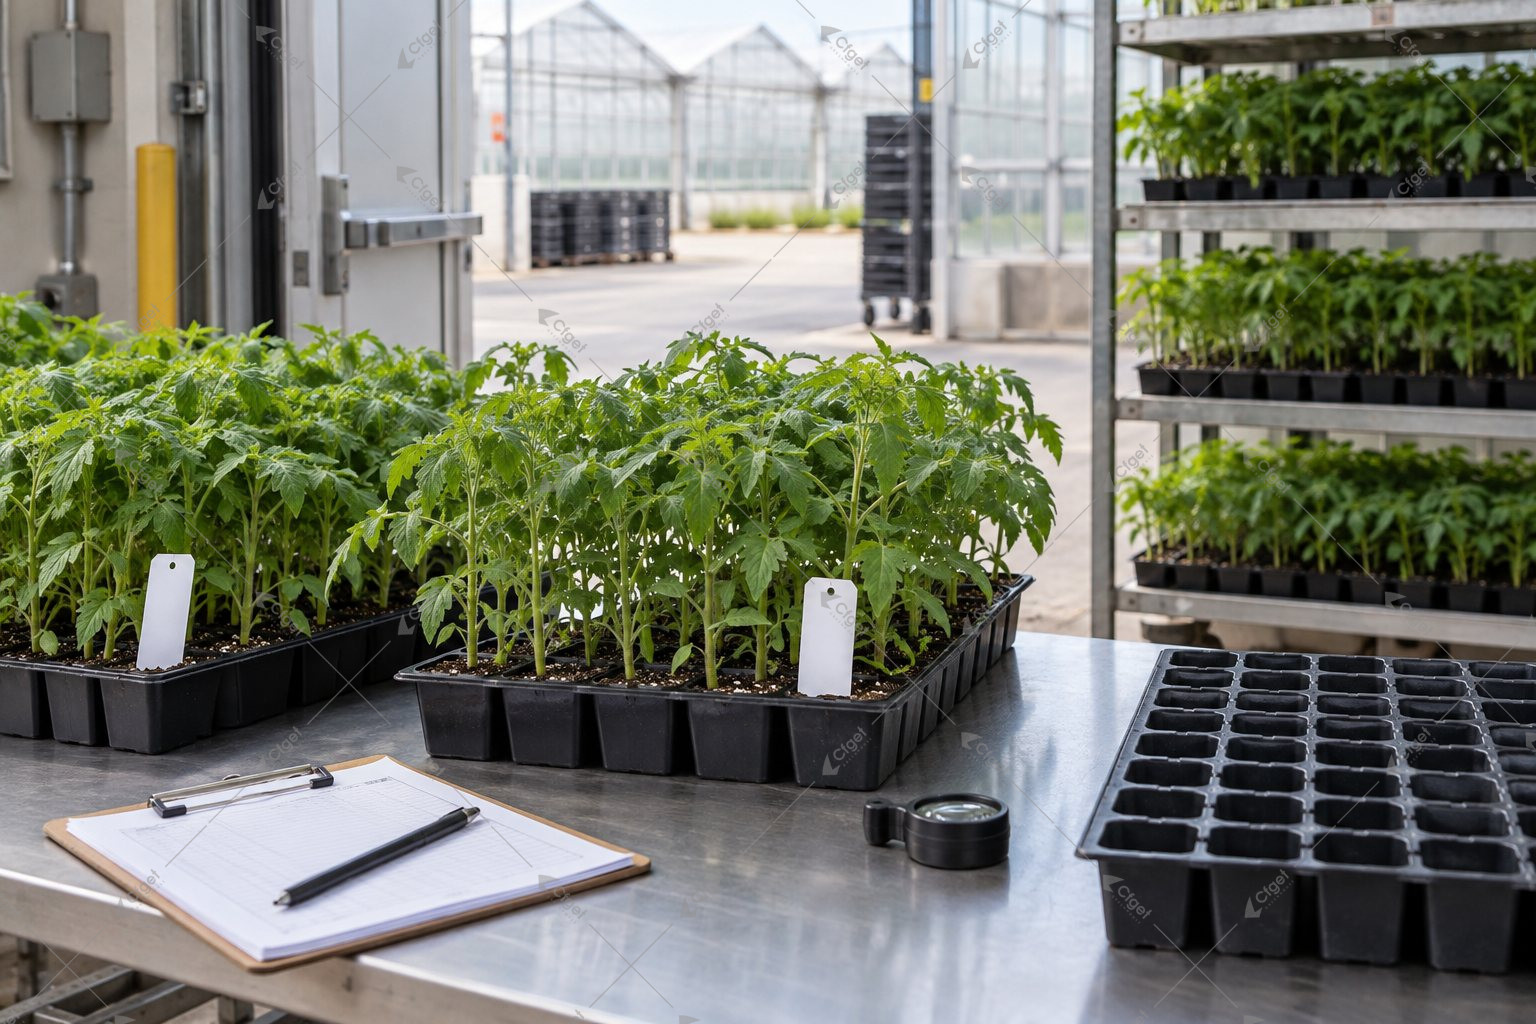
One card has forty insects and another has ten. The first sounds worse until you discover that it hung for two weeks while the second was replaced yesterday. A trap count becomes useful only when its location, exposure and identification are recorded well enough to compare.
Sticky cards are monitoring tools, not a complete pest census. Use them to locate activity and follow trends, then inspect the crop for the pest and life stage that matters. Do not convert every rising count into an automatic spray instruction.
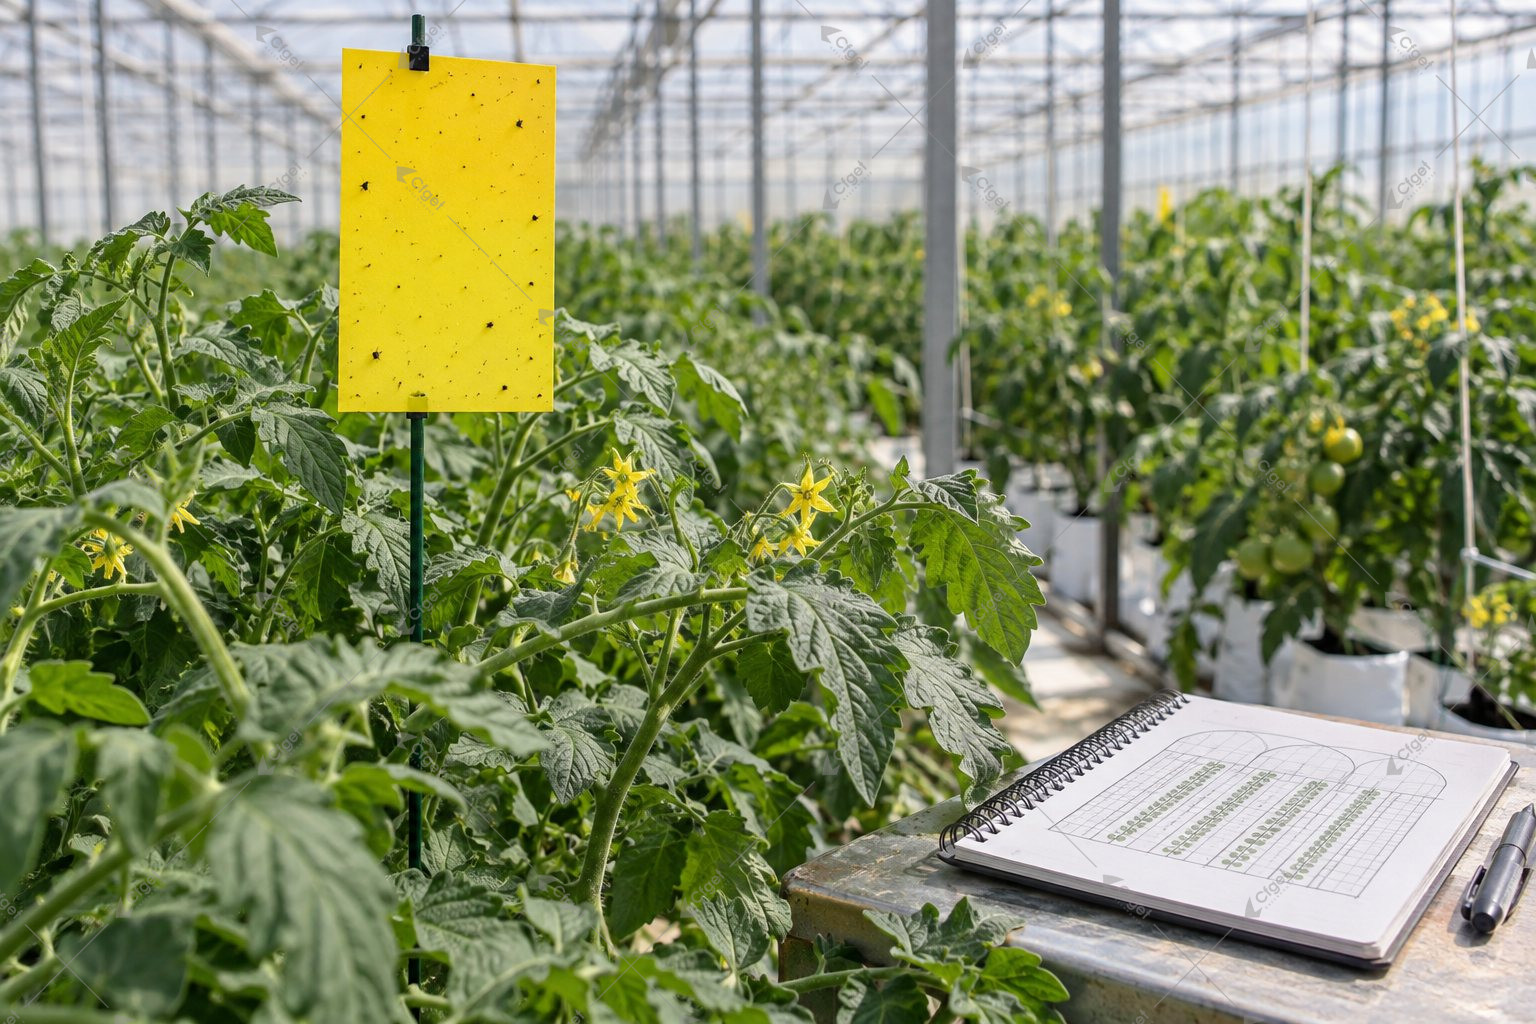
Make each card a repeatable sampling point
Give each position a permanent identifier and place it on a greenhouse map. Record crop, planting date, card type, height relative to the canopy, installation date and reading date. Keep the position consistent unless there is a clear reason to move it; record that move rather than splicing two locations into one trend.
UMass IPM scouting guidance combines sticky-card observations with crop inspection and greenhouse maps. Different pests require different places and methods of observation. In particular, a low count of flying adults does not establish the absence of nonflying stages on leaves or in growing media.
Compare exposure before comparing abundance
Here is a hypothetical record, not a CFGET monitoring result:
| Card | Count of the same identified pest group | Exposure | Simple count per day |
|---|---|---|---|
| North-01 | 28 | 7 days | 4 |
| South-01 | 18 | 3 days | 6 |
Dividing count by days makes the mismatch visible. It does not make the traps scientifically equivalent: a dirty or saturated card, different canopy height, weather changes and different card types can change catch efficiency. Mark compromised samples as such instead of treating their calculated rates as precise measurements.
Separate identified pest groups in the record. An overall insect total can rise because harmless visitors increased while a target pest declined. If identification is uncertain, save a clear image and a specimen or card as advised by the diagnostic service; label the count provisional.
Read the map alongside the plants
A rise near a door suggests an inspection route, not proof that the door caused the infestation. Examine nearby crops, incoming plant material and weeds, and compare adjacent cards. A cluster over one bench warrants plant-level inspection there and in a comparison area.
- On leaves, record the relevant eggs, larvae, nymphs or adults and signs of feeding.
- For suspected substrate pests, use an appropriate root-zone monitoring method.
- Record natural enemies and recent releases or treatments with the pest observation.
- Note new stock, crop removal, screen damage and other events that can explain a discontinuity.
Keep an observation separate from its interpretation: “adult count increased at East-03” is a record; “immigration through the door” is a hypothesis until checked. That distinction makes the log useful to a visiting adviser.
Define who makes the decision
The response depends on the identified pest, crop stage, damage tolerance, virus risk and existing control program. There is no defensible universal card count that tells every greenhouse to spray. Agree with the crop-protection adviser on a trigger for closer inspection, escalation and treatment review, and record who is responsible.
After a control action, keep the same monitoring method and inspect the relevant life stage on plants. A short-term adult catch change is not, on its own, proof of complete control or failure.
Start with a usable record this week
Draw the map, number the positions, define a consistent reading interval and add one field for the next action and its owner. The greenhouse pest-management guide covers the wider prevention context. For a CFGET facility review, use the map to discuss inspection access, compartment boundaries and entry routes; do not select structural changes from an unexplained insect total.