By Coraline Liao, CEO, CFGET | Reviewed by CFGET Project Planning Team | Updated: July 24, 2026
One yellow plant beside a blocked emitter is different from an entire edge row fading after a hot week. A patch that follows a drainage channel tells another story. If all three receive the same foliar spray, the team has treated a symptom instead of investigating the system.
Greenhouse IPM begins with pattern, timing and evidence. It combines pest and disease scouting with root-zone, irrigation and climate records.
This guide helps you:
- isolate where and when a problem began;
- inspect non-pest causes before choosing a treatment;
- collect useful samples;
- decide when local laboratory, extension or crop-protection support is needed.
The blueberry greenhouse planning guide connects IPM with structure, water, crop stage and operating skill.
Stop the spread and preserve evidence
When staff find an unusual symptom:
1. mark the plant and location;
2. photograph the whole plant, affected tissue and surrounding zone;
3. record cultivar, plant age and crop stage;
4. note recent irrigation, climate, spray and maintenance events;
5. avoid moving tools, substrate or drainage into clean zones;
6. collect samples using local diagnostic-laboratory instructions;
7. retain untreated evidence where crop safety allows.
Do not pull every affected plant before mapping the pattern. Removal may be necessary, but first record what the distribution can tell you.
Map the pattern before naming the cause
Use a greenhouse plan and shade affected plants or zones.
| Pattern | First system questions |
| One plant | Emitter, outlet, roots, mechanical damage, plant source |
| One row or irrigation zone | Pressure, dosing, line blockage, valve, shared drainage |
| Edge rows | Heat, wind, cold leakage, light, container temperature |
| Near cooling inlet or exhaust | Temperature gradient, wetting, airflow |
| Low floor area | Standing water, drainage, cold-air pooling |
| One cultivar | Phenology, sensitivity, plant source, management fit |
| Whole house after an event | Source water, fertilizer batch, spray, power or weather failure |
| Expanding circular or contact pattern | Pathogen or pest movement, drainage or worker route |
Pattern does not prove a diagnosis. It tells you where to sample and which records deserve attention.
Beginner takeaway
An insect, a root problem and a nutrient disorder can all change leaf colour. Find the spatial pattern before using the symptom chart.
Check roots, water and delivery
Blueberry’s fine roots can decline before the canopy shows a clear signal. Select symptomatic and apparently healthy comparison plants from the same and different zones.
Inspect:
- live root colour and condition;
- odour and obvious decay;
- moisture distribution through the container;
- blocked or submerged drainage openings;
- emitter output and pressure;
- source, feed and drainage pH and EC trends;
- recent water-source, fertilizer or acid changes;
- root-zone temperature.
Use the root-zone design guide for sampling points and the irrigation guide for delivery checks.
Do not wash roots from every sample if a diagnostic laboratory requests intact root and substrate material. Ask first.
Reconstruct the climate event
Plants often show damage after the causative event has passed. Review raw records, alarms and equipment states for the previous hours or days.
Check:
- leaf or fruit temperature during high radiation;
- cold zones and heater response;
- relative humidity, dew point and condensation duration;
- vent, screen, fan, shade and cooling position;
- power failures and manual overrides;
- irrigation timing during the event;
- whether one sensor represented the affected zone.
Cornell’s greenhouse Botrytis blight guidance explains how condensation, sanitation and greenhouse air management affect disease pressure. A pathogen still needs confirmation when symptoms overlap other causes.
Scout pests with a route and a clock
Random walking produces random records. Use the same route, inspect designated plants and change the frequency with crop stage and risk.
Include:
- doors, vents and screen edges;
- new plant material and propagation areas;
- weeds and vegetation around the structure;
- upper and lower leaf surfaces;
- flowers and developing fruit;
- containers, substrate surface and drainage;
- sticky cards or traps appropriate to the local program.
Record zero observations too. “No mites found on 20 marked plants” is more useful than a blank field.
The University of California Statewide IPM Program maintains blueberry pest-management guidelines with pest-specific monitoring and management information. Use the biology and scouting logic in the relevant production context. Chemical registrations, labels and resistance programs remain local.
Keep the bloom plan inside IPM
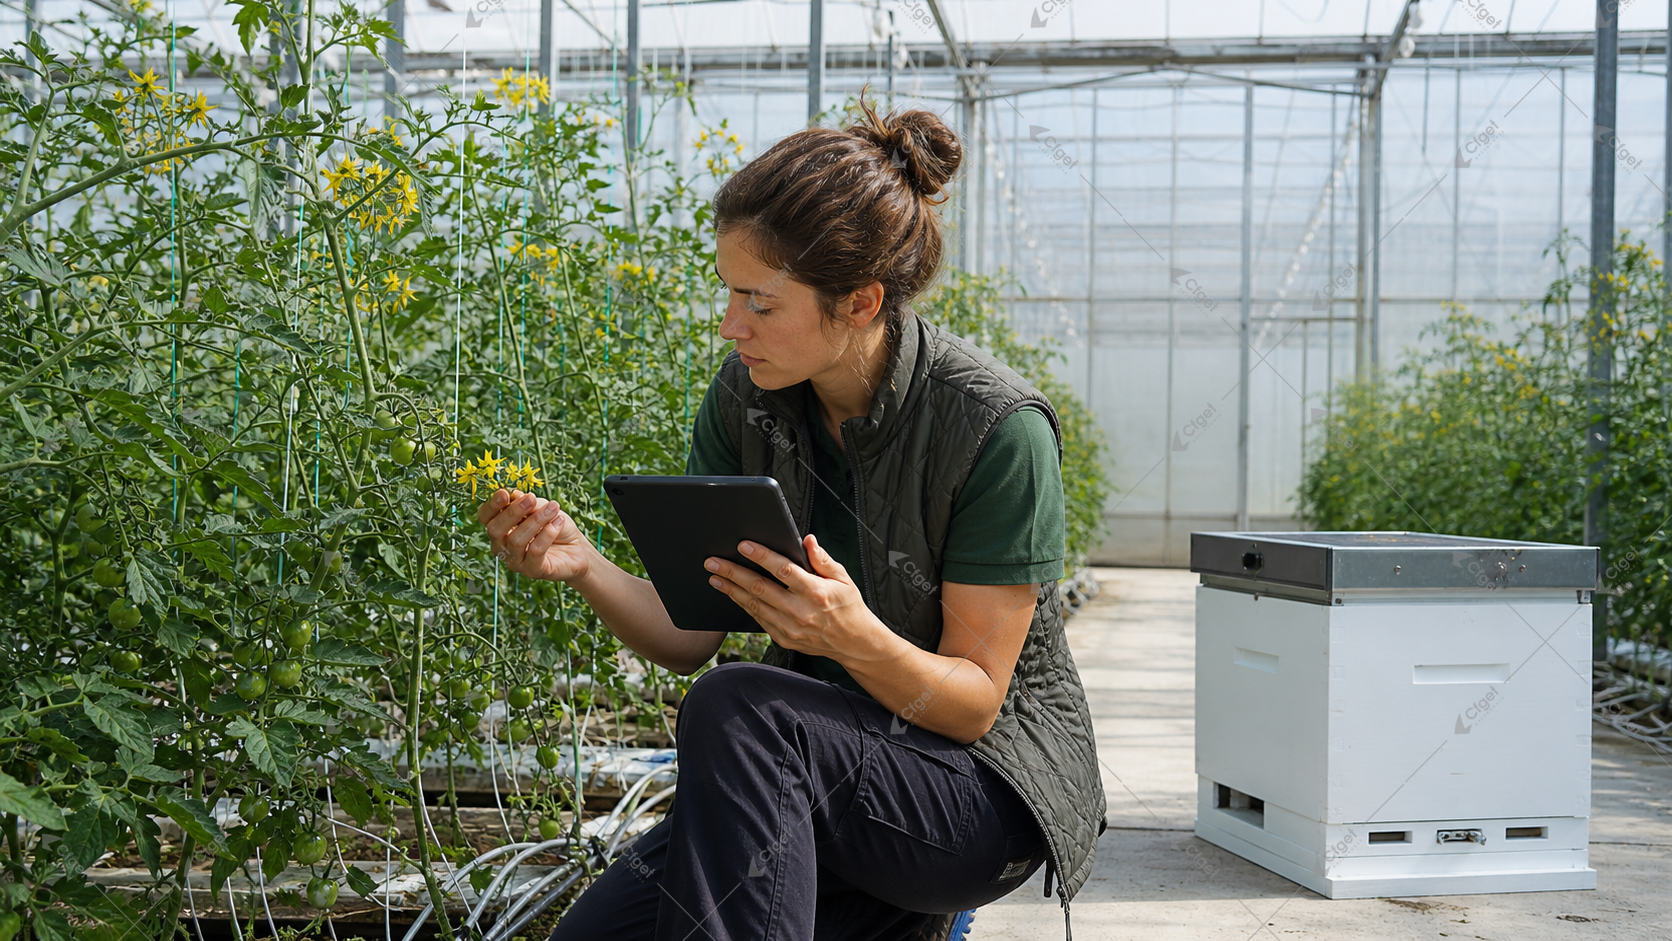
Bloom creates a tight operating boundary. Pollinators, open flowers, disease risk and spray restrictions overlap.
Before bloom:
- review current local labels and registrations;
- agree on communication among scout, crop lead, spray operator and pollination supplier;
- identify products or timings that create pollinator risk;
- define ventilation and re-entry procedures;
- inspect flowers for damage before attributing weak set to insects or bees.
UF/IFAS publishes a Florida blueberry IPM guide and separate pollination-period pesticide guidance. Both are useful regional references. Product choices must be checked against the current label and regulations where the greenhouse operates.
Use a five-part diagnosis
1. Confirm the symptom
Describe tissue, location, age and progression. “Plant looks bad” cannot be compared later.
2. Compare a healthy reference
Choose the same cultivar and stage where possible. Sample both under the same method.
3. Test delivery and environment
Check emitters, root-zone condition, climate and recent changes before assuming a biological agent.
4. Look for the organism or sign
Insects, spores, lesions or root decay may direct the next step. A photo alone may still be insufficient.
5. Escalate with a useful sample
Send the laboratory or adviser the map, history, photos, comparison material and treatment record. This shortens the guessing cycle.
Professional grower note
Keep a “last known normal” timestamp for climate, flow, dosing and crop observations. During a failure review, it narrows the evidence window and protects the event log from hindsight.
Common symptoms and first checks
| Symptom | First checks | Evidence that may be needed |
| Interveinal yellowing | pH trend, root health, water alkalinity, tissue stage | Water, substrate and tissue tests |
| Marginal burn | EC trend, dry-back, heat, source ions, spray history | Source/feed/drainage comparison |
| Sudden wilt | Emitter, root-zone moisture, root damage, heat event | Root and irrigation inspection |
| Weak fruit set | Bloom overlap, flower damage, visits, climate | Bloom and pollination map |
| Fruit drop after set | Root stress, heat, crop load, disease | Stage records and sample |
| Grey growth or flower decay | Condensation, sanitation, air movement | Diagnostic confirmation |
| Repeated pests near vents | Screen, gaps, outside hosts, airflow | Entry-point and trap map |
These are starting points. Several causes can operate together.
Correct the cause and verify the response
A corrective action needs:
- a named diagnosis or working hypothesis;
- affected and comparison zones;
- action owner and time;
- crop-safety and regulatory check;
- measurements expected to change;
- review date;
- criteria for stopping, repeating or escalating.
If a treatment is used, retain the label, batch, rate, application record and environmental conditions. If irrigation or climate is changed, retain the previous setting and verify the crop-floor result.
The user-identified CFGET ventilation greenhouse video shows containers, irrigation lines, openings or screened zones and a local control enclosure. It does not show a pest, disease diagnosis or measured performance. Those visible system boundaries are still useful when planning where to scout and which zones to compare.
About this review
Coraline Liao, CEO of CFGET, reviewed this page with attention to separating root, irrigation and climate faults from pest or disease evidence. Her public LinkedIn profile describes her as a Greenhouse Technical Director with more than 15 years in the greenhouse industry.
The CFGET Project Planning Team completed the technical review. Cited research, direct observations from CFGET’s Chengdu footage and professional interpretation are kept separate. Local crop advisers, laboratories, engineers and authorities must confirm decisions that depend on cultivar, site or regulation.
Project video: greenhouse project reference
This field video gives a quick project visual to read beside the specifications and RFQ checklist.
Frequently asked questions
Are greenhouse blueberries free from pests?
No. Protection can reduce some entry routes while creating stable conditions for pests that enter. Doors, vents, plants, tools, workers and water remain possible pathways.
Should yellow blueberry leaves be treated with iron?
Not before checking roots, pH method, water alkalinity, EC, emitter function and tissue stage. A nutrient treatment will not correct a blocked emitter or oxygen-poor root zone.
Can a photo diagnose blueberry disease?
A photo can guide the first questions, but many symptoms overlap. A reliable diagnosis may require roots, tissue, pathogen signs, laboratory testing and the production history.
How often should greenhouse blueberries be scouted?
Frequency should reflect crop stage, pest biology, season, previous history and local advice. Keep the route and method consistent so a change in counts means something.
Your next action
Prepare a response kit before the next problem:
1. print the greenhouse zone and cultivar map;
2. label healthy reference plants;
3. define the scouting route and sample method;
4. list the local diagnostic laboratory and crop adviser;
5. keep water, feed, climate, spray and maintenance records accessible;
6. stock clean sample bags, labels and disinfection materials;
7. agree who can isolate a zone or pause a spray.
Add these responsibilities to the stage-based crop calendar and the greenhouse project checklist. Prevention works better when the operating team knows what evidence to preserve.