By Coraline Liao, CEO, CFGET | Reviewed by CFGET Project Planning Team | Updated: July 24, 2026
A blueberry irrigation program can deliver the planned daily volume and still fail the crop. The first rows may receive more pressure. A hot edge row may dry between pulses. Another zone may stay saturated overnight. Drainage from the whole block can look acceptable while individual containers drift apart.
The useful question is not “How many minutes should blueberries run?” It is “What happened between the emitter and the drain?”
This article sets up a monitoring method that answers that question. It covers:
- delivery uniformity;
- pulse size and timing;
- drainage volume, pH and EC;
- water and fertilizer system checks;
- a controlled process for making adjustments.
Complete the blueberry container and substrate guide first. The irrigation schedule can only be as good as the root zone it serves.
Start with a simple water balance
For a selected group of representative containers, measure:
`water retained over the period = irrigation delivered – drainage collected`
Plant uptake and evaporation remove part of the retained water. Change in substrate storage accounts for the rest. This is not a complete physiological model, but it reveals whether the operating record matches the crop floor.
Choose monitoring containers that represent:
- pressure near, middle and far from the irrigation inlet;
- sunny and shaded positions;
- edge and central rows;
- vigorous and less vigorous plants;
- each substrate, container or cultivar block.
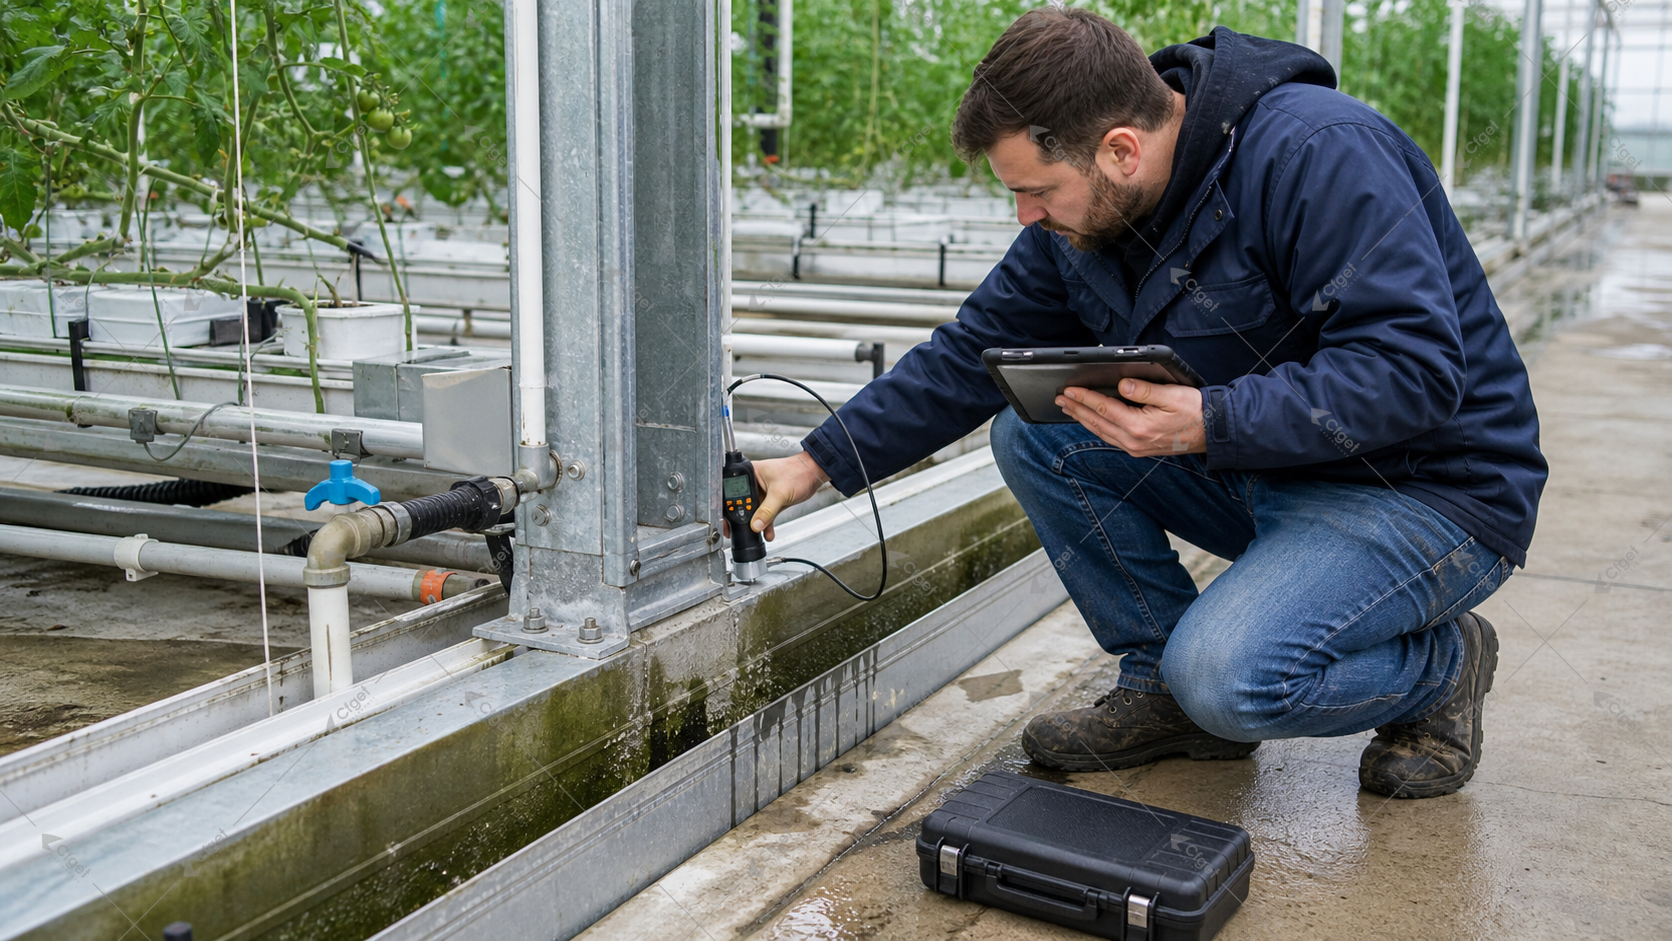
Measure actual emitter output into a graduated container for a fixed time. Do not rely solely on the nominal emitter rating.
Beginner takeaway
The controller records what it asked the valve to do. A catch test shows what the plant actually received.
Check distribution before changing the recipe
When plants vary by zone, start with hydraulics.
1. Confirm source pressure and filter condition.
2. Run the zone at its normal operating state.
3. Collect emitter discharge at representative locations.
4. Compare start-up and shut-down behaviour.
5. Inspect for drainage after the intended pulse.
6. Repeat after maintenance to confirm the correction.
Look beyond average flow. A satisfactory average can hide a weak far end and over-watered near end.
Ask the system supplier for:
| Evidence | Why it matters |
| Zone flow and pressure calculation | Tests whether pipe and valve sizes fit the operating block |
| Filter specification and alarm logic | Links source-water load to emitter protection |
| Injector operating range | Shows whether dosing remains accurate at expected flow |
| Flushing velocities and valve locations | Makes routine line cleaning possible |
| Pressure and flow measurement points | Allows the operator to verify performance |
| Chemical compatibility | Prevents damage to emitters, seals and tanks |
| Failure mode | Defines what happens after low pressure, empty stock or power loss |
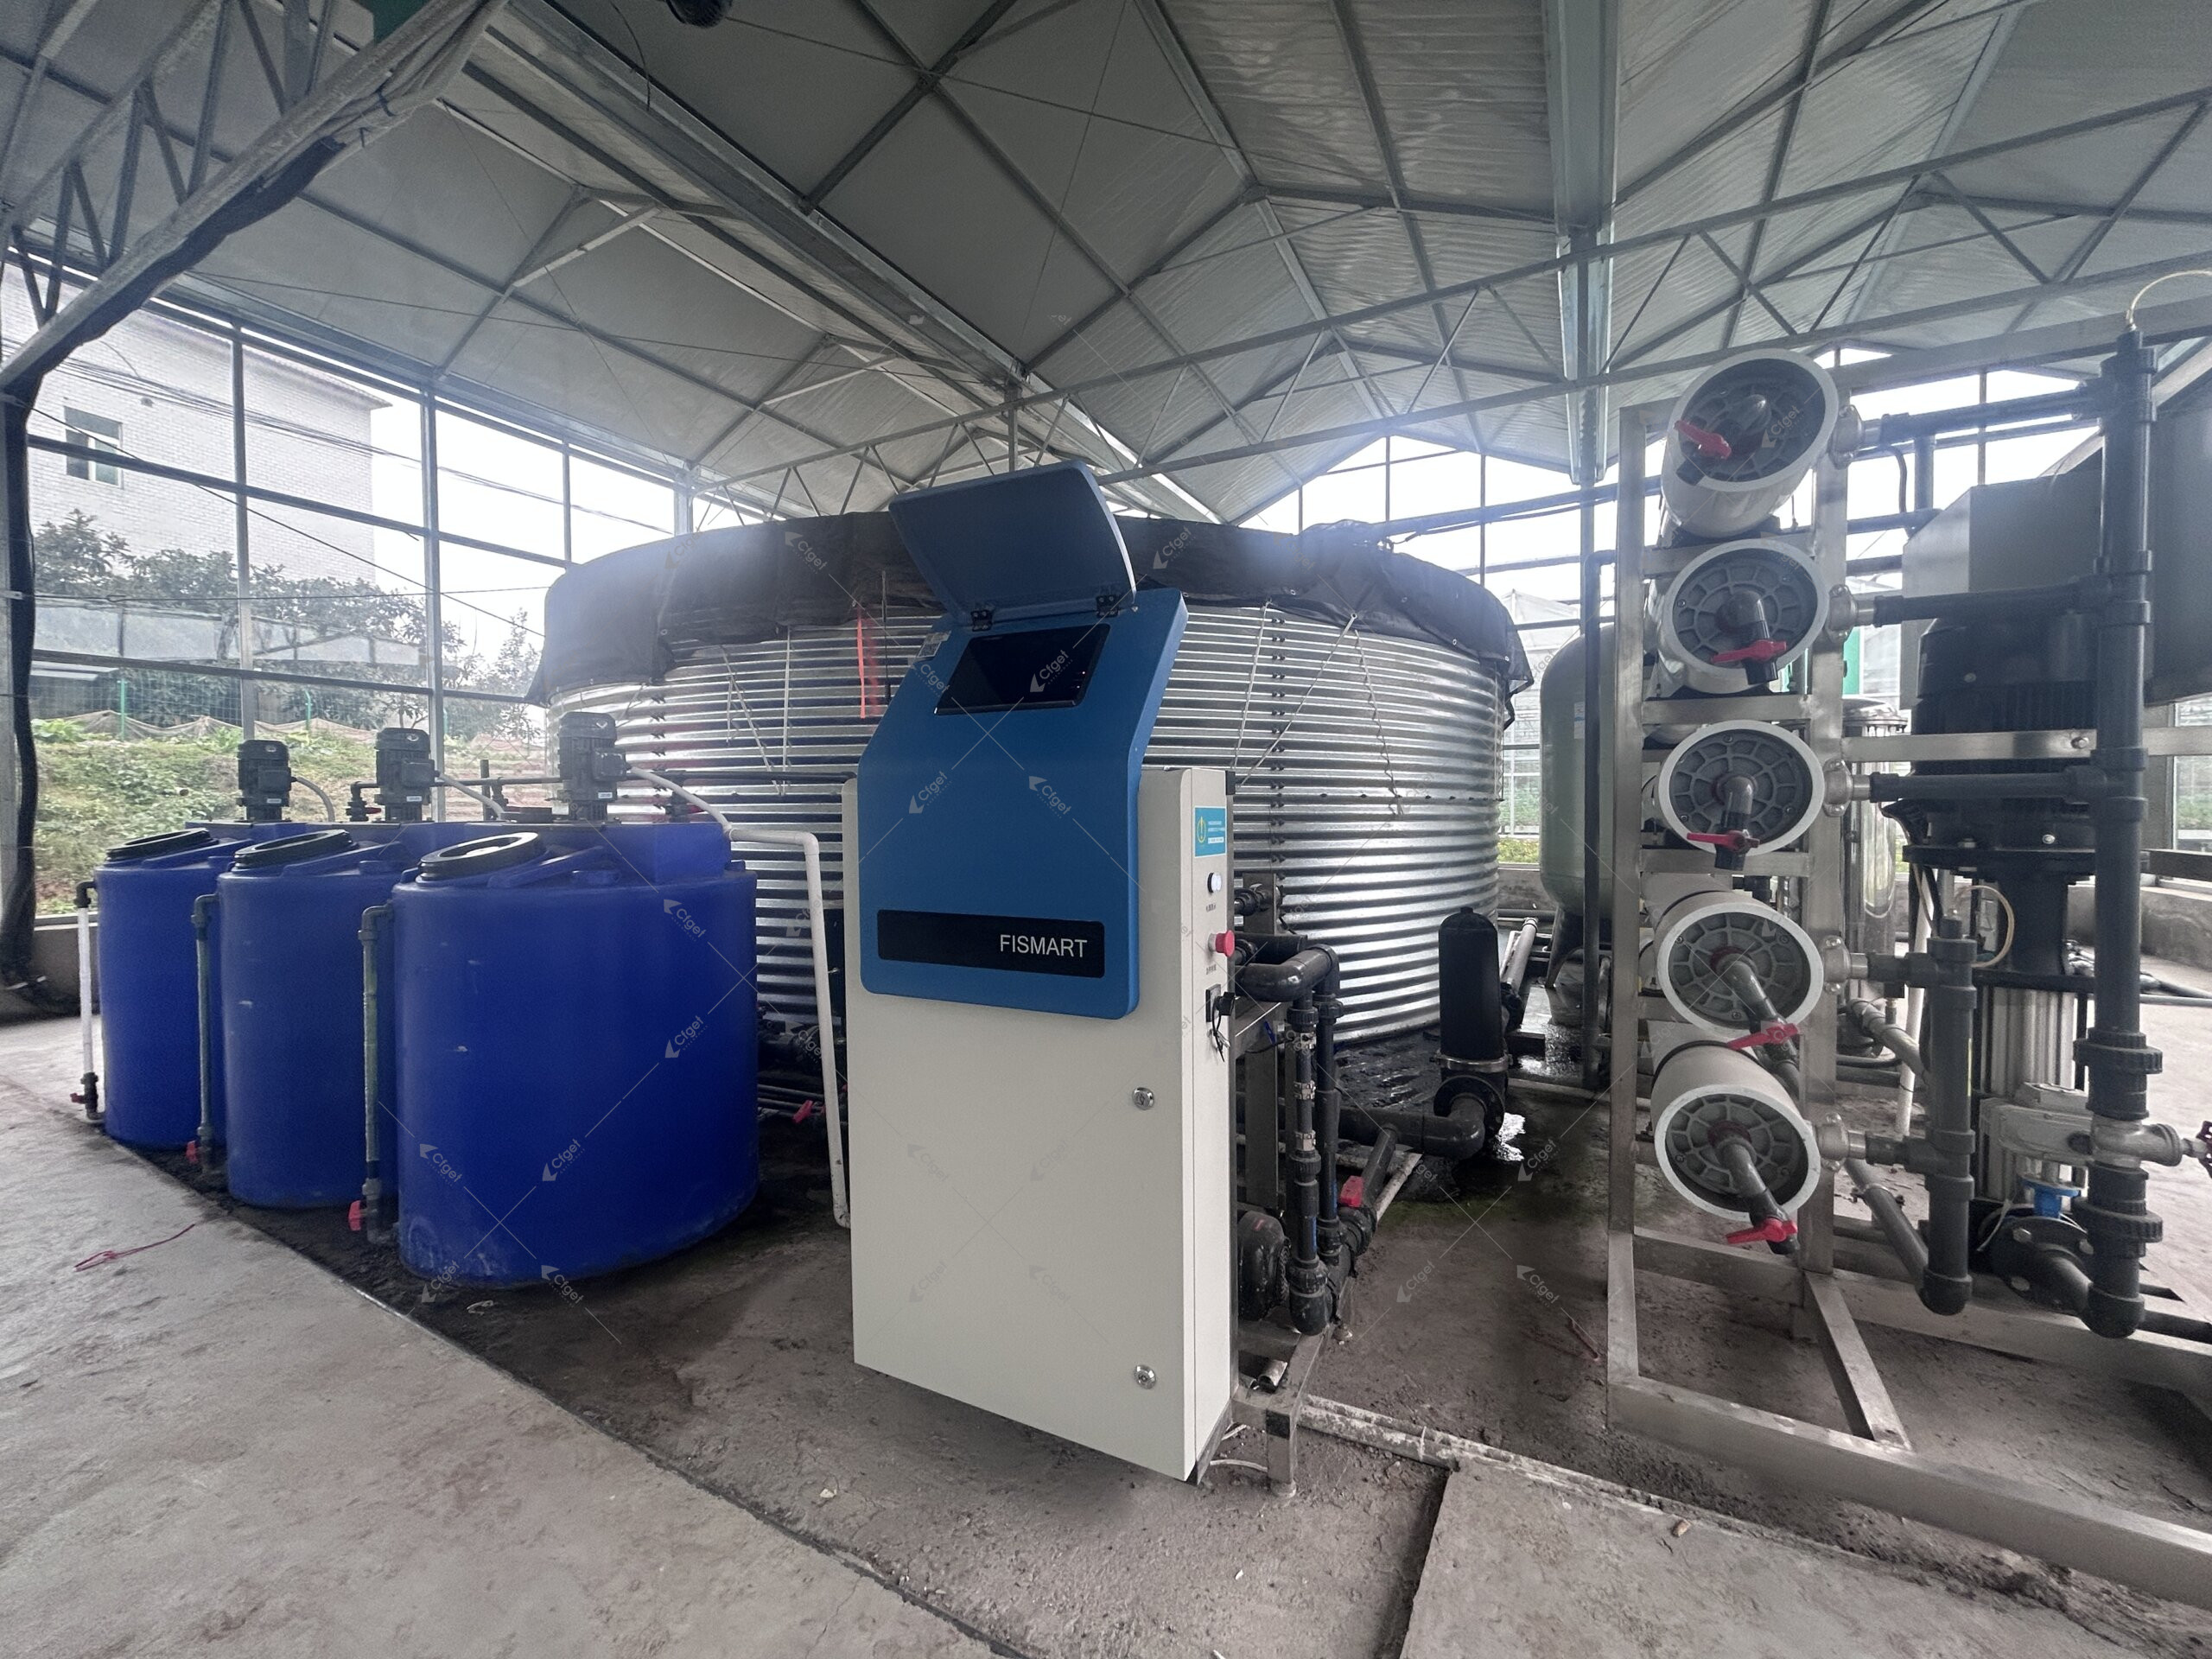
The CFGET greenhouse fertigation overview can orient the equipment discussion. The project still needs calculations for its own water, zones and emitters.
Use short pulses only when the root zone can recover
Container blueberry systems often use relatively frequent irrigation because the managed root volume is small. UF/IFAS discusses short, frequent fertigation in Florida southern highbush container production and warns about drainage and salinity. See Introduction to Southern Highbush Blueberry Cultivation in Containers.
That is a principle, not a schedule to copy.
Pulse timing depends on:
- container and substrate water storage;
- rooted volume and plant size;
- radiation, temperature, humidity and air movement;
- emitter flow and wetted pattern;
- water quality and salt-management strategy;
- crop stage and crop load;
- the time needed for drainage and re-aeration.
An irrigation event that is too small may wet only a narrow path. One that is too large may push water and nutrients straight through. Pulses too late in the day can leave the root zone and greenhouse unnecessarily wet overnight.
Professional grower note
Record the first drainage time after irrigation begins and the time drainage ends. A shift can indicate changed substrate behaviour, root occupancy, emitter flow or antecedent moisture even when total daily volume is unchanged.
Drainage percentage is a diagnostic, not a universal target
A common calculation is:
`drainage fraction = collected drainage / measured irrigation input`
Use it on representative containers over a defined period. Record the weather, crop stage and previous moisture condition.
The result can help reveal:
- under-delivery or excessive dry-back;
- excessive application;
- uneven wetting;
- changed plant demand;
- accumulation risk when paired with pH and EC trends.
It cannot show root-zone oxygen, distribution inside the pot or plant uptake by itself. It also should not be forced to one fixed percentage every day. A deliberate salt-management event and a cool low-demand day have different purposes.
Trend chemistry at the same points
Set fixed sampling locations for source water, mixed feed and representative drainage. If recirculation is used, include water before and after treatment.
Record:
- pH and EC;
- irrigation input and drainage volume;
- stock-tank batch or fertilizer lot;
- acid or treatment settings;
- crop stage;
- relevant weather and climate events;
- operator actions.
Source-water pH does not reveal alkalinity. Penn State Extension explains why alkalinity, soluble salts and individual ions should be interpreted separately in Interpreting Irrigation Water Tests.
If drainage EC rises, do not immediately dilute fertilizer. Check emitter output, root-zone moisture, source-water change, recent heat, plant demand, drainage method and sampling consistency. Correct the cause that the evidence supports.
Fertilizer decisions need crop and regional evidence
Blueberry nutrient programs vary with cultivar group, substrate, water and crop stage. Oregon State University’s Nutrient Management for Blueberries in Oregon shows how regional soil and tissue interpretation supports nutrient decisions. It should not be transplanted as a container-greenhouse recipe elsewhere.
Use a hierarchy:
1. local crop and cultivar guidance;
2. accredited water analysis;
3. substrate or soil testing with a known method;
4. calibrated feed and drainage records;
5. plant tissue analysis at a defined stage;
6. visual symptoms as a prompt for investigation, not proof.
Change one major variable at a time where crop safety allows. Record the date and expected response. Otherwise the team cannot tell which correction worked.
Map demand instead of averaging the greenhouse
The user-identified CFGET ventilation greenhouse video visibly shows repeated containers, individual irrigation tubes and a large protected block. It does not provide emitter flow, irrigation frequency or uniformity results.
Its useful lesson is spatial. Divide the crop into operating zones when meaningful differences exist in:
- solar exposure;
- cultivar or plant age;
- substrate or container;
- elevation and pipe length;
- climate-control response;
- harvest stage.
Do not create more zones than the team can monitor and maintain. A zone is useful only if there is a clear reason to operate it differently.
A daily and weekly operating rhythm
Daily
- review alarms, zone flow and pressure;
- walk edge, centre, near and far positions;
- inspect representative emitters and drainage;
- note weather, shade and vent changes;
- record unusual plant or substrate conditions.
Weekly or at a locally justified interval
- run a repeatable emitter catch test;
- compare representative input and drainage;
- measure pH and EC at fixed points;
- inspect filters, flush points, injectors and stock tanks;
- review trends with crop stage and climate data.
After a change or failure
- isolate the affected zones;
- document the previous and new settings;
- verify output at the crop;
- inspect roots and drainage where exposure was material;
- follow the response until readings and plants stabilize.
Troubleshooting by pattern
| Observation | First checks | Avoid this shortcut |
| Far end dries first | Pressure, pipe loss, flushing, emitter output | Adding time to the whole zone |
| Drainage EC rises in hot weather | Input volume, dry-back, source EC, crop demand | Changing fertilizer concentration alone |
| Pots stay wet overnight | Last pulse, drainage, substrate change, low demand | Adding airflow without correcting irrigation |
| Pale plants in one row | Emitters, root condition, zone dosing | Assuming a nutrient deficiency from leaf colour |
| Feed reading is correct, plants vary | Distribution, sample location, root-zone state | Trusting the mixing-room sensor as the crop result |
The blueberry IPM and troubleshooting guide expands this into a full root-climate-pest diagnosis.
About this review
Coraline Liao, CEO of CFGET, reviewed this page with attention to water treatment, dosing, delivery uniformity and drainage records. Her public LinkedIn profile describes her as a Greenhouse Technical Director with more than 15 years in the greenhouse industry.
The CFGET Project Planning Team completed the technical review. Cited research, direct observations from CFGET’s Chengdu footage and professional interpretation are kept separate. Local crop advisers, laboratories, engineers and authorities must confirm decisions that depend on cultivar, site or regulation.
Project video: greenhouse climate control in practice
This field video shows a greenhouse climate system in use, which helps buyers check whether the quoted equipment matches the site conditions.
Frequently asked questions
How often should container blueberries be irrigated?
There is no safe global interval. Base frequency on the substrate’s storage and aeration, rooted volume, crop demand, weather, emitter performance and drainage response.
Should every irrigation include fertilizer?
That depends on the local program, source water, substrate, crop stage and salt-management strategy. Verify the delivered solution and plant response rather than treating constant feeding as a rule.
Can drainage water be reused?
Potentially, with collection, testing, filtration, disinfection, chemistry management and a safe reject route. The crop-protection and regulatory implications must be assessed locally.
What should trigger an irrigation alarm?
Useful alarms include unexpected zone flow or pressure, injector deviation, empty stock, filter differential pressure, tank level and a climate or root-zone condition that the operating team has defined as actionable.
Your next action
Run a seven-day baseline before optimizing the schedule:
1. select representative containers and label them;
2. verify emitter output and pressure;
3. measure input, first drainage time and drainage volume;
4. trend source, feed and drainage pH and EC;
5. record crop stage and climate conditions;
6. map any recurring wet, dry or weak zones;
7. adjust one variable, then repeat the same measurements.
Use the findings to specify zones, filters, dosing, monitoring and alarms in the blueberry greenhouse RFQ. CFGET’s irrigation and fertilization systems can then be evaluated against measured operating needs rather than a generic crop schedule.